Facts + Statistics: Motorcycle crashes

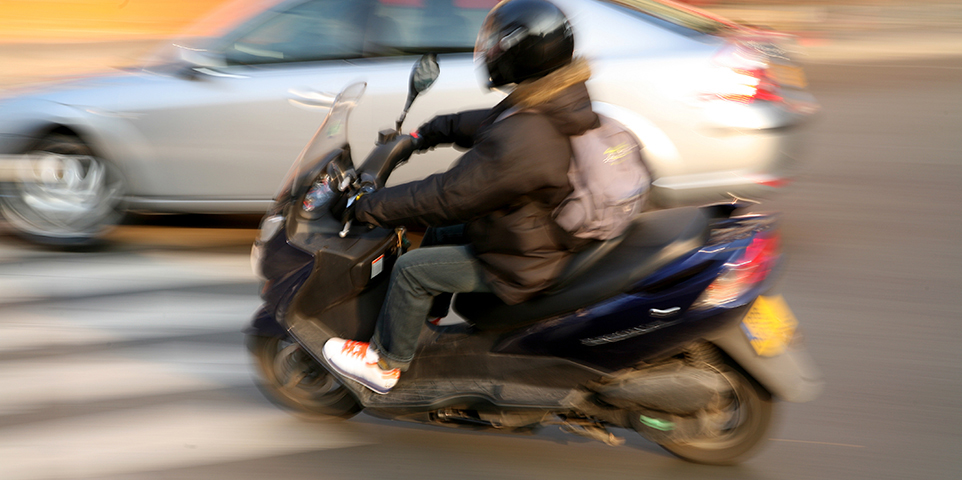
Motorcycles are by their nature far less crashworthy than closed vehicles. They are also less visible to other drivers and pedestrians and less stable than four-wheel vehicles. Operating a motorcycle requires a different combination of physical and mental skills than those used in driving four-wheel vehicles. Motorcyclists and their passengers are more vulnerable to the hazards of weather and road conditions than drivers in closed vehicles.

 
Motorcycle Helmet Use, 2000-2021 (1)


Year Percent Year Percent
2000 71% 2016 65%
2005 48 2017 65
2010 54 2018 71
2013 60 2019 71
2014 64 2020 69
2015 61 2021 65

(1) Based on surveys of motorcyclists using helmets meeting Department of Transportation standards. Surveys conducted in October for 1996-2000 and in June thereafter.

Source: U.S. Department of Transportation, National Occupant Protection Use Survey, National Highway Traffic Safety Administration's National Center for Statistics and Analysis.

View Archived Tables

 
Motorcyclist Fatalities And Fatality Rates, 2011-2020


Year Fatalities Registered
motorcycles
Fatality rate per
100,000 registered
motorcycles
Vehicle miles
traveled
(millions)
Fatality rate per
100 million vehicle
miles traveled
2011 4,630 8,437,502 54.87 18,542 24.97
2012 4,986 8,454,939 58.97 21,385 23.32
2013 4,692 8,404,687 55.83 20,366 23.04
2014 4,594 8,417,718 54.58 19,970 23.00
2015 5,029 8,600,936 58.47 19,606 25.65
2016 5,337 8,679,380 61.49 20,445 26.10
2017 5,226 8,664,108 60.32 20,149 25.94
2018 5,038 8,659,741 58.18 20,076 25.09
2019 5,044 8,596,314 58.68 19,688 25.62
2020 5,579 8,317,363 67.08 17,632 31.64

Source: U.S. Department of Transportation, National Highway Traffic Safety Administration; Federal Highway Administration.

View Archived Tables

 
Motorcyclist Injuries And Injury Rates, 2011-2020


Year Injuries Registered motorcycles Injury rate per 100,000
registered motorcycles
Vehicle miles
traveled (millions)
Injury rate per
100 million vehicle
miles traveled
2011 82,000 8,437,502 968 18,542 441
2012 93,000 8,454,939 1,103 21,385 436
2013 89,000 8,404,687 1,056 20,366 436
2014 92,000 8,417,718 1,093 19,970 461
2015 89,000 8,600,936 1,032 19,606 453
2016 (1) 104,000 8,679,380 1,203 20,445 511
2017 89,000 8,664,108 1,023 20,149 440
2018 82,000 8,659,741 945 20,076 408
2019 84,000 8,596,314 975 19,688 426
2020 83,000 8,317,363 992 17,632 468

(1) NHTSA began using police-reported crash data from the Crash Report Sampling System, replacing the National Automotive Sampling System
General Estimates System (GES). NCSA has also changed the methodology of estimating people nonfatally injured in motor vehicle traffic crashes.

Source: U.S. Department of Transportation, National Highway Traffic Safety Administration; Federal Highway Administration.

View Archived Tables

 
Occupant Fatality Rates By Vehicle Type, 2011 And 2020


Fatality rate Motorcycles Light trucks Passenger cars
2011      
     Per 100,000 registered vehicles 54.87 7.84 9.46
     Per 100 million vehicle miles traveled 24.97 0.73 0.88
2020      
     Per 100,000 registered vehicles 67.08 6.90 10.79
     Per 100 million vehicle miles traveled 31.64 0.74 1.15
Percent change, 2011-2020      
     Per 100,000 registered vehicles 22.3% -12.0% 14.1%
     Per 100 million vehicle miles traveled 26.7% 1.4% 30.7%

Source: U.S. Department of Transportation, National Highway Traffic Safety Administration.

View Archived Tables

 
Motorcyclists Killed, by Time of Day and Day of Week, 2020


  Day of week
  Weekday Weekend Total
  Number Percent Number Percent Number Percent
Motorcyclists killed            
Midnight to 3 am 151 5.5% 278 9.9% 429 7.7%
3 am to 6 am 79 2.9 115 4.1 194 3.5
6 am to 9 am 166 6.0 66 2.4 232 4.2
9 am to Noon 221 8.0 205 7.3 426 7.6
Noon to 3 pm 478 17.3 418 14.9 896 16.1
3 pm to 6 pm 716 25.9 547 19.5 1,263 22.6
6 pm to 9 pm 547 19.8 676 24.1 1,223 21.9
9 pm to Midnight 391 14.1 483 17.2 874 15.7
Unknown 16 0.6 18 0.6 42 0.8
Total 2,765 100.0% 2,806 100.0% 5,579 (1) 100.0%

(1) Includes motorcyclists killed on unknown day of week.

Source: U.S. Department of Transportation, National Highway Safety Administration.

View Archived Tables

 
Vehicles Involved In Fatal Crashes By Vehicle Type, 2011 And 2020


Vehicle involved 2011 2020
Passenger cars    
Involved in crashes 17,508 20,868
Rate per 100 million vehicle miles traveled 1.28 1.79
Rate per 100,000 registered vehicles 13.79 16.71
Light trucks (1)    
Involved in crashes 16,806 20,566
Rate per 100 million vehicle miles traveled 1.31 1.47
Rate per 100,000 registered vehicles 14.16 13.72
Motorcycles    
Involved in crashes 4,769 5,715
Rate per 100 million vehicle miles traveled 25.72 32.41
Rate per 100,000 registered vehicles 56.52 68.71

(1) Trucks with 10,000 pounds or less gross vehicle weight. Includes pickups, vans, truck-based station wagons and utility vehicles.

Source: U.S. Department of Transportation (USDOT), National Highway Traffic Safety Administration (NHTSA). Vehicle miles traveled - USDOT, Federal Highway Administration, revised by NHTSA; Registered passenger cars and light trucks - R.L. Polk & Co; Registered motorcycles - USDOT, Federal Highway Administration.

View Archived Tables

 
Persons Killed In Total And Alcohol-Impaired Crashes By Person Type, 2020


    Alcohol-impaired crash fatalities (1)
Person type Total killed Number Percent of
total killed
Vehicle occupants      
     Driver 19,519 6,756 35%
     Passenger 5,966 1,866 31
     Unknown occupant 51 3 7
     Total 25,536 8,626 34%
Motorcyclists 5,579 1,803 32%
Nonoccupants      
     Pedestrian 6,516 1,048 16
     Pedalcyclist 938 126 13
     Other/unknown 255 51 20
     Total 7,709 1,225 16%
Total 38,824 11,654 30%

(1) Alcohol-impaired driving crashes are crashes that involve at least one driver or a motorcycle operator with a blood alcohol concentration (BAC) of 0.08 grams per deciliter or greater, the legal definition of alcohol-impaired driving.

Source: U.S. Department of Transportation, National Highway Traffic Safety Administration.

View Archived Tables

 
Drivers In Fatal Crashes By Blood Alcohol Concentration (BAC) And Vehicle Type, 2011-2020 (1)


  Passenger car Light truck Large truck Motorcycles
    Percent   Percent   Percent   Percent
Year Total BAC = 0.01+ BAC = 0.08+ Total BAC = 0.01+ BAC = 0.08+ Total BAC = 0.01+ BAC = 0.08+ Total BAC = 0.01+ BAC = 0.08+
2011 17,401 27% 24% 16,706 25% 21% 3,594 3% 1% 4,761 37% 29%
2012 18,171 26 23 17,230 25 21 3,774 3 2 5,108 35 28
2013 17,850 27 23 16,810 25 21 3,872 4 2 4,795 35 27
2014 17,802 26 22 17,040 25 22 3,701 3 2 4,703 37 29
2015 19,688 25 21 18,763 24 21 4,019 2 1 5,126 34 26
2016 20,730 24 21 19,951 23 20 4,152 3 2 5,414 32 25
2017  20,895   24   21   19,847  23 20  4,600  4 3  5,316  35 27
2018 20,175  24   21  19,663 22 19 4,786 5 3 5,108 33 25
2019 19,469 24 20 19,704 22 19 4,949 3 2 5,111 36 29
2020 20,742 26 23 20,402 23 19 4,778 4 3 5,711 34 27

(1) NHTSA estimates alcohol involvement when alcohol test results are unknown.

Source: U.S. Department of Transportation, National Highway Safety Administration.

View Archived Tables

Back to top

Auto
Background on: Motorcycle crashes