MEMBERSHIP
AMPLIFY
EN ESPAÑOL
Connect With Us
- Popular search terms
- Automobile
- Home + Renters
- Claims
- Fraud
- Hurricane
- Popular Topics
- Automobile
- Home + Renters
- The Basics
- Disaster + Preparation
- Life Insurance
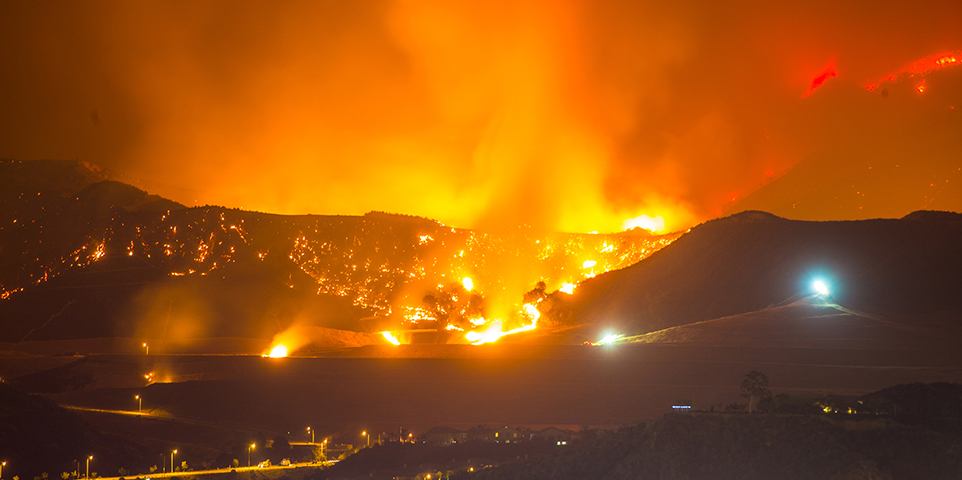
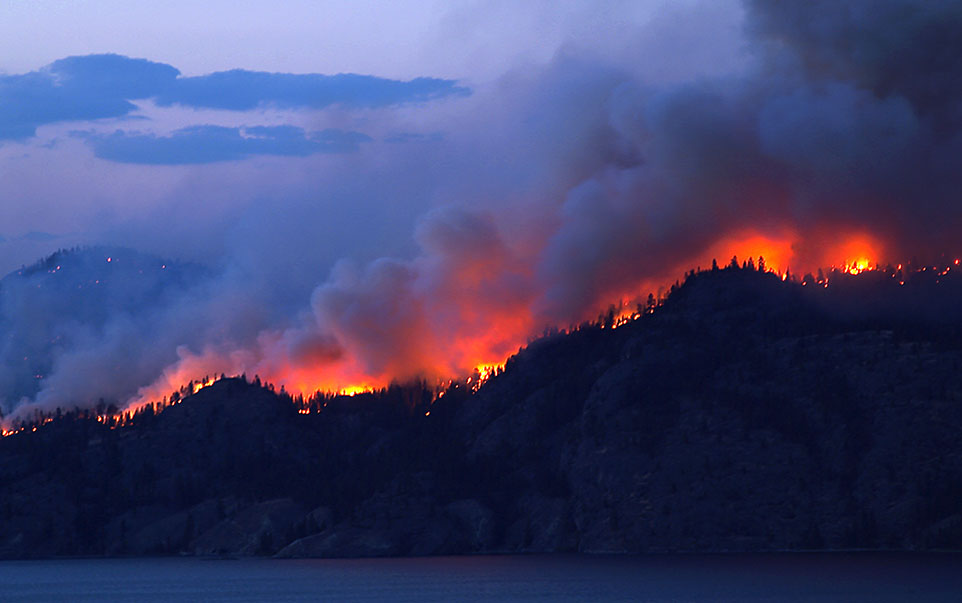
Fire plays an important role in the life of a forest, clearing away dead wood and undergrowth to make way for younger trees. But for much of the last century, fire-suppression policies have sought to extinguish wildfires as quickly as possible to preserve timber and real estate. This approach has led to the accumulation of brush and other vegetation that is easily ignited and serves as fuel for wildfires.
Most of the large fires with significant property damage have occurred in California, where some of the fastest developing counties are in forest areas that were once largely uninhabited. These areas, known as the Wildland-Urban Interface (WUI), contained about a third of all housing units in the United States in 2017, according to the U.S. Forest Service. Fast-growing areas with moderate to high wildland fire potential range from parts of the South to large parts of the West. Rising temperatures and more intense droughts are also believed to contribute to large, destructive blazes. Warmer weather contributes to wildfire conditions in many ways: dryer and more combustible vegetation, more frequent lightning strikes, an extended fire season, more intense winds and earlier spring snowmelt in mountainous areas leading to dry vegetation earlier in the wildfire season. A typical wildfire season would run from mid-summer to early autumn, but with these changing conditions wildfires are becoming a year-round occurrence.
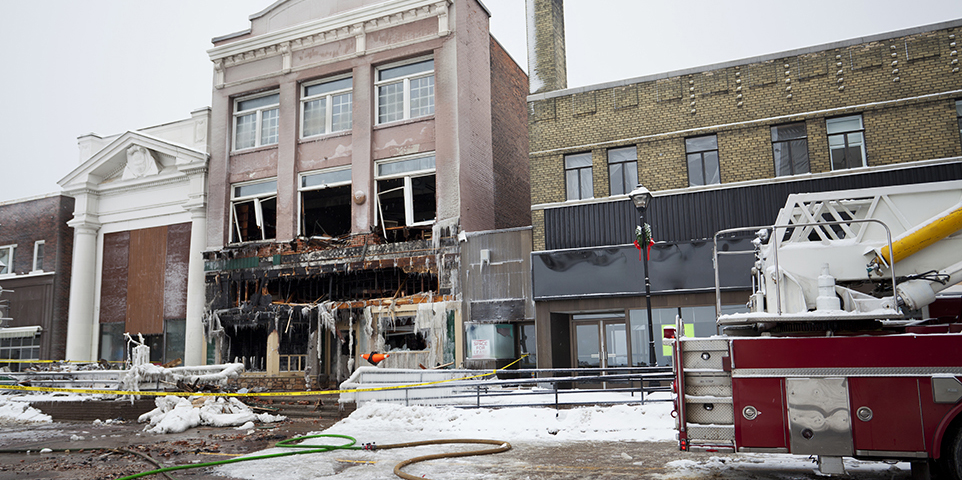
Damage caused by fire and smoke are covered under standard homeowners, renters and business owners insurance policies and under the comprehensive portion of an auto insurance policy. Water or other damage caused by fire fighters to extinguish the fire is also covered under these policies. In California, the California FAIR Plan covers residential and commercial properties located in brush and wildfire areas. Properties in those areas are subject to higher rates due to increased risk of fire
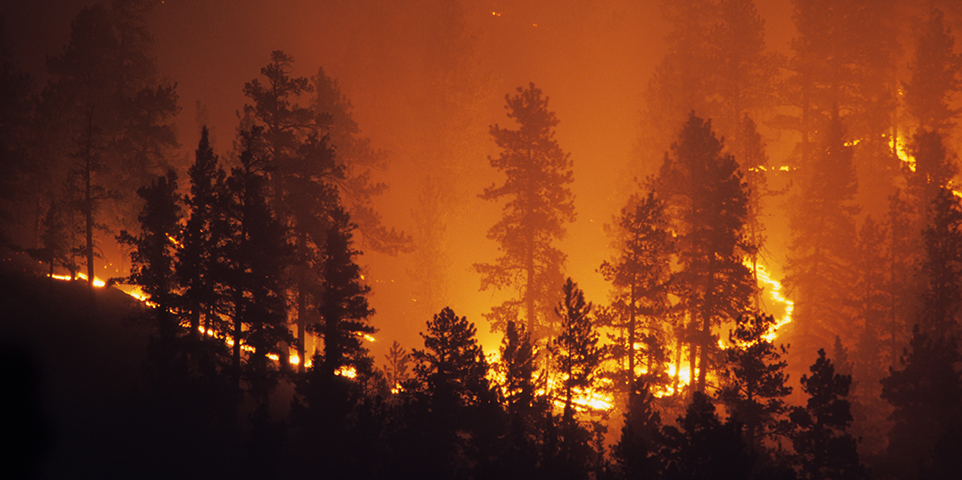
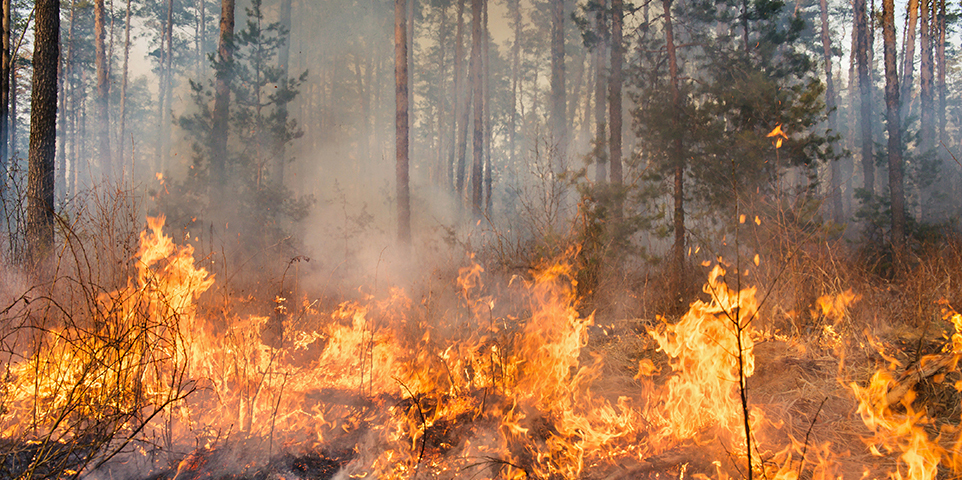
As many as 90 percent of wildland fires in the United States are caused by humans, according to the U.S. Department of Interior. Some human-caused fires result from campfires left unattended, the burning of debris, downed power lines, negligently discarded cigarettes and intentional acts of arson. The remaining 10 percent are started by lightning or lava.
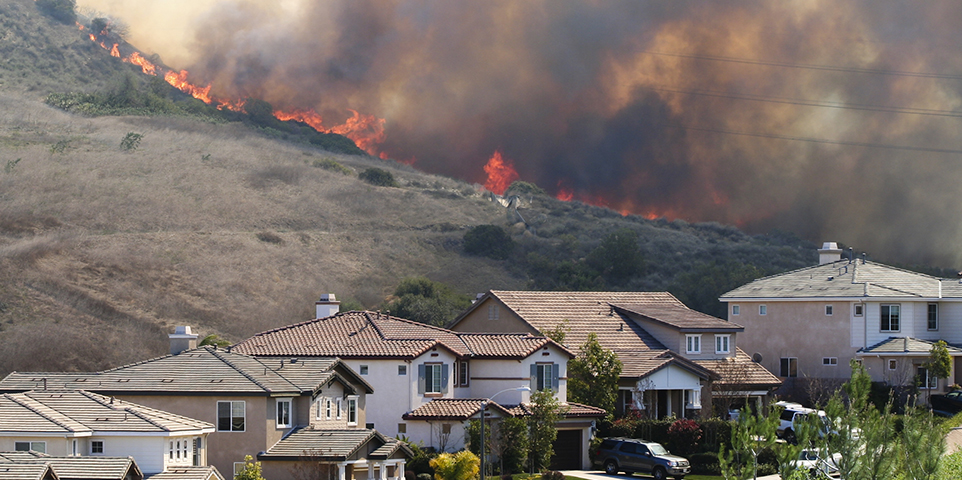
Researchers are discovering that embers blown by the wind during wildfires cause most of the fires that burn homes. Also, homes that are less than 15 feet apart are more likely to burn in clusters. In such cases, fire is often spread by combustible fences and decks connected to houses, a study by the Insurance Institute for Business & Home Safety (IBHS) found.
Among the preventive features recommended in the IBHS study were noncombustible siding, decking and roofing materials; covered vents; and fences not connected directly to the house. In addition, combustible structures in the yard such as playground equipment should be at least 30 feet away from the house and vegetation 100 feet away.
FireLine®, Verisk’s wildfire risk management tool, assesses wildfire risk at the address level using advanced remote sensing and digital mapping technology. The three primary factors considered in analyzing wildfire risk are distribution of vegetative fuel, steepness of slope and degree of access for firefighting equipment. FireLine assigns a wildfire hazard score for each factor plus a cumulative score, on a scale from negligible to extreme risk. The following chart ranks the most wildfire-prone western U.S. states by high to extreme wildfire risk as of 2021. According to Verisk estimates, in California, there were more than 2 million properties at high to extreme wildfire risk in 2021, the largest number of properties of any U.S. state.
|
Source: CoreLogic®, a property data and analytics company.
($ millions)
|
(1) Natural disasters that cause at least $25 million in insured losses; or 10 deaths; or 50 people injured; or 2,000 filed claims or homes and structures damaged. Includes Puerto Rico and the U.S. Virgin Islands.
(2) Includes any direct physical damage or direct net loss business interruption costs.
(3) Includes losses sustained by private insurers and government-sponsored programs such as the National Flood Insurance Program. Subject to change as loss estimates are further developed. As of January 2023.
~ =Approximately.
Source: Aon.
|
Source: National Interagency Fire Center.
($ millions)
|
||||||||||||||||||||||||||||||||||||||||||||||||||||||||||||
(1) Includes losses sustained by private insurers and government-sponsored programs such as the National Flood Insurance Program. Includes events that occurred through 2021. All fires on this list occurred in California. Includes Puerto Rico and the U.S. Virgin Islands. Ranked on losses in 2021 dollars. Subject to change as loss estimates are further developed. As of Feburary 3, 2022.
(2) Adjusted for inflation by Aon using the U.S. Consumer Price Index.
Source: Aon.
Verisk Insurance Solutions' FireLine State Risk Report
National Interagency Fire Center
Headwaters Economics - The Rising Cost of Wildfire Protection
Insurance Institute for Business & Home Safety – Wildfire resources
National Fire Prevention Administration - Wildfire safety tips
Cal Fire's ReadyforWildfire.org
© Insurance Information Institute, Inc. - ALL RIGHTS RESERVED